How to Trade EUR/USD Using Charts
Traders looking to speculate on EUR/USD positions have several ways to keep track of the pair’s ongoing performance using charts. There are also a number of different methods that traders can choose from to trade the currency pair, such as options trading. Let’s take a look at the various charts and trading methods available with the EUR/USD.

Illustrative prices.
What are EUR/USD charts?
When EUR/USD prices rise, this means that it now takes more Dollars to buy one Euro than it did previously. When the price goes down, it will take fewer Dollars to buy one Euro. For example, if the price moves from 1.50 to 1.65, then it would cost an extra 15 cents to purchase one Euro. An easy way to view these price changes is on a trading chart.
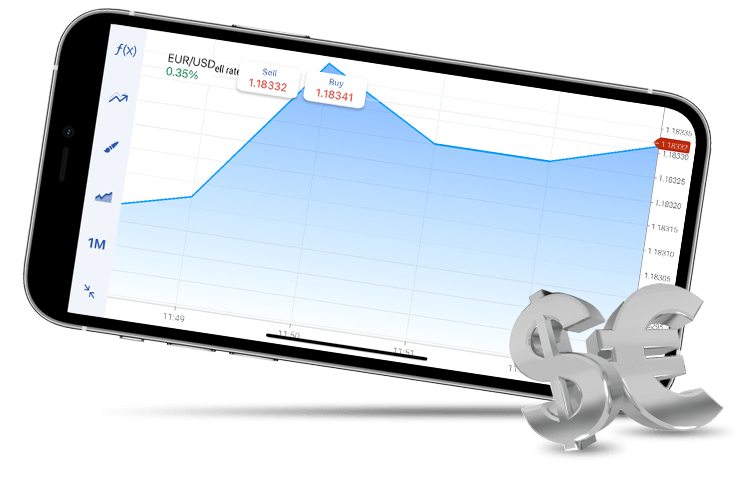
EUR/USD charts offer a historical outlook of the price movements of the EUR/USD. The charts can be set to show different time scales, and offer multiple views to help traders use the included data to make decisions about future positions. Some of the methods for displaying EUR/USD prices include line charts, bar charts and candlesticks.
The line chart is the simplest method of viewing the EUR/USD forex pair’s price history. It plots the closing price of the instrument for the time period that the trader selects. While the line chart provides a way to visualise what happens to the price of EUR/USD during the trading day, it only shows the closing price data, so less critical pricing information such as highs and lows are not considered. Line charts provide information about where the EUR/USD traded before, which makes it easier to compare those prices to where the price is now, potentially making it easier to spot ongoing trends.
The EUR/USD bar chart consists of a series of bars. Each bar’s vertical line expresses the difference between the pair’s high and low price for the selected time frame, while a horizontal bar to the left denotes the instrument’s opening price and a horizontal bar to the right points to the pair’s closing price. Bar charts provide more information about a EUR/USD trading session than a line chart. Longer vertical lines point to periods of increased volatility, as they show more price movements between that session’s high and low points. Shorter bars develop when there has been less of a price movement.
Candlestick charts have a similar makeup to bar charts. However, the space between the open and closing points are coloured in to form a solid block called a candle. If the EUR/USD closing price was higher than the opening price for the time interval selected , then the candle body is coloured green. If the EUR/USD opening price was higher than the closing price, then the candle body is coloured red. Two vertical lines coming out of the top and bottom of the candle body show the high and low points.
In addition to the information available from a bar chart, candlestick charts are often used to show common trading patterns which can be seen when looking at multiple candles grouped together. These patterns may be used to help predict upcoming EUR/USD price movements.
As the EUR/USD is always presented as a pair, the chart itself will only show price movements, and will not reflect why the pair’s price rose or fell. The price can move if the Euro or Dollar weakens or strengthens. One way to tell which factor was decisive in shifting the currency pairs' price would be to pay attention to the news about the two currencies and the regions they represent. You can also review the behaviour of other Forex pairs that contain the Euro or the Dollar.
How to trade EUR/USD
There are many ways to speculate on the EUR/USD currency pair. You could physically take Euros and exchange them for Dollars at a bank or money changers, or alternatively, you could exchange Dollars for Euros. You could also buy and sell larger sums of euros and dollars by using an investment bank.
Another way to trade EUR/USD is via CFDs with a CFD provider such as Plus500. With CFDs, your profit or loss is based on the movement of the underlying currency pair, as you are not buying or selling actual currencies. When you trade CFDs with Plus500, you gain exposure to higher levels of profit and loss because you trade EUR/USD using leverage.* This means that you only need to put down a portion of the trade’s value in order to open a position. With Plus500 CFD trading is also commission-free, although there may be other fees associated with opening or holding onto the trade.
EUR/USD traders may also want to look into trading Options. With Options trading, you select a strike price that you believe the currency pair will hit within a given timeframe. CFD providers like Plus500 usually offer Options CFDs** with a range of both Put and Call strike prices to choose from.
EUR/USD trading offers traders many different choices when it comes to tracking prices and earning a profit or loss on the movements of the two currencies. It is a good idea to research the various charting and trading methods thoroughly so that you can pick the ones that best suit your needs.
*Leveraged trading involves substantial risk of losing all invested funds in a short period of time.
**Instrument availability varies by operator.
